Datart

I’ve always been fascinated by the subtle ways technology weaves itself into our daily lives, quietly shaping our routines, relationships, and decisions through data we often don’t even notice.
What began as a curiosity about the numbers behind everyday moments turned into an ongoing exploration of how personal data can tell compelling, human-centered stories.
Data isn't just about statistics and dashboards. It’s about capturing real moments: the calls we make, the places we love, the habits we form, and the cities that shape us. Through visualizing my own experiences, I’ve uncovered patterns and insights that not only reflect who I am but also how technology silently documents the rhythm of modern life.

A Tribute to Milan
To mark five years in Milan, a city that shaped many aspects of my personal and professional life, I created a visual tribute. I mapped meaningful locations, bike routes, favorite spots, and homes I’d lived in, all simplified into a personal cartographic artwork.
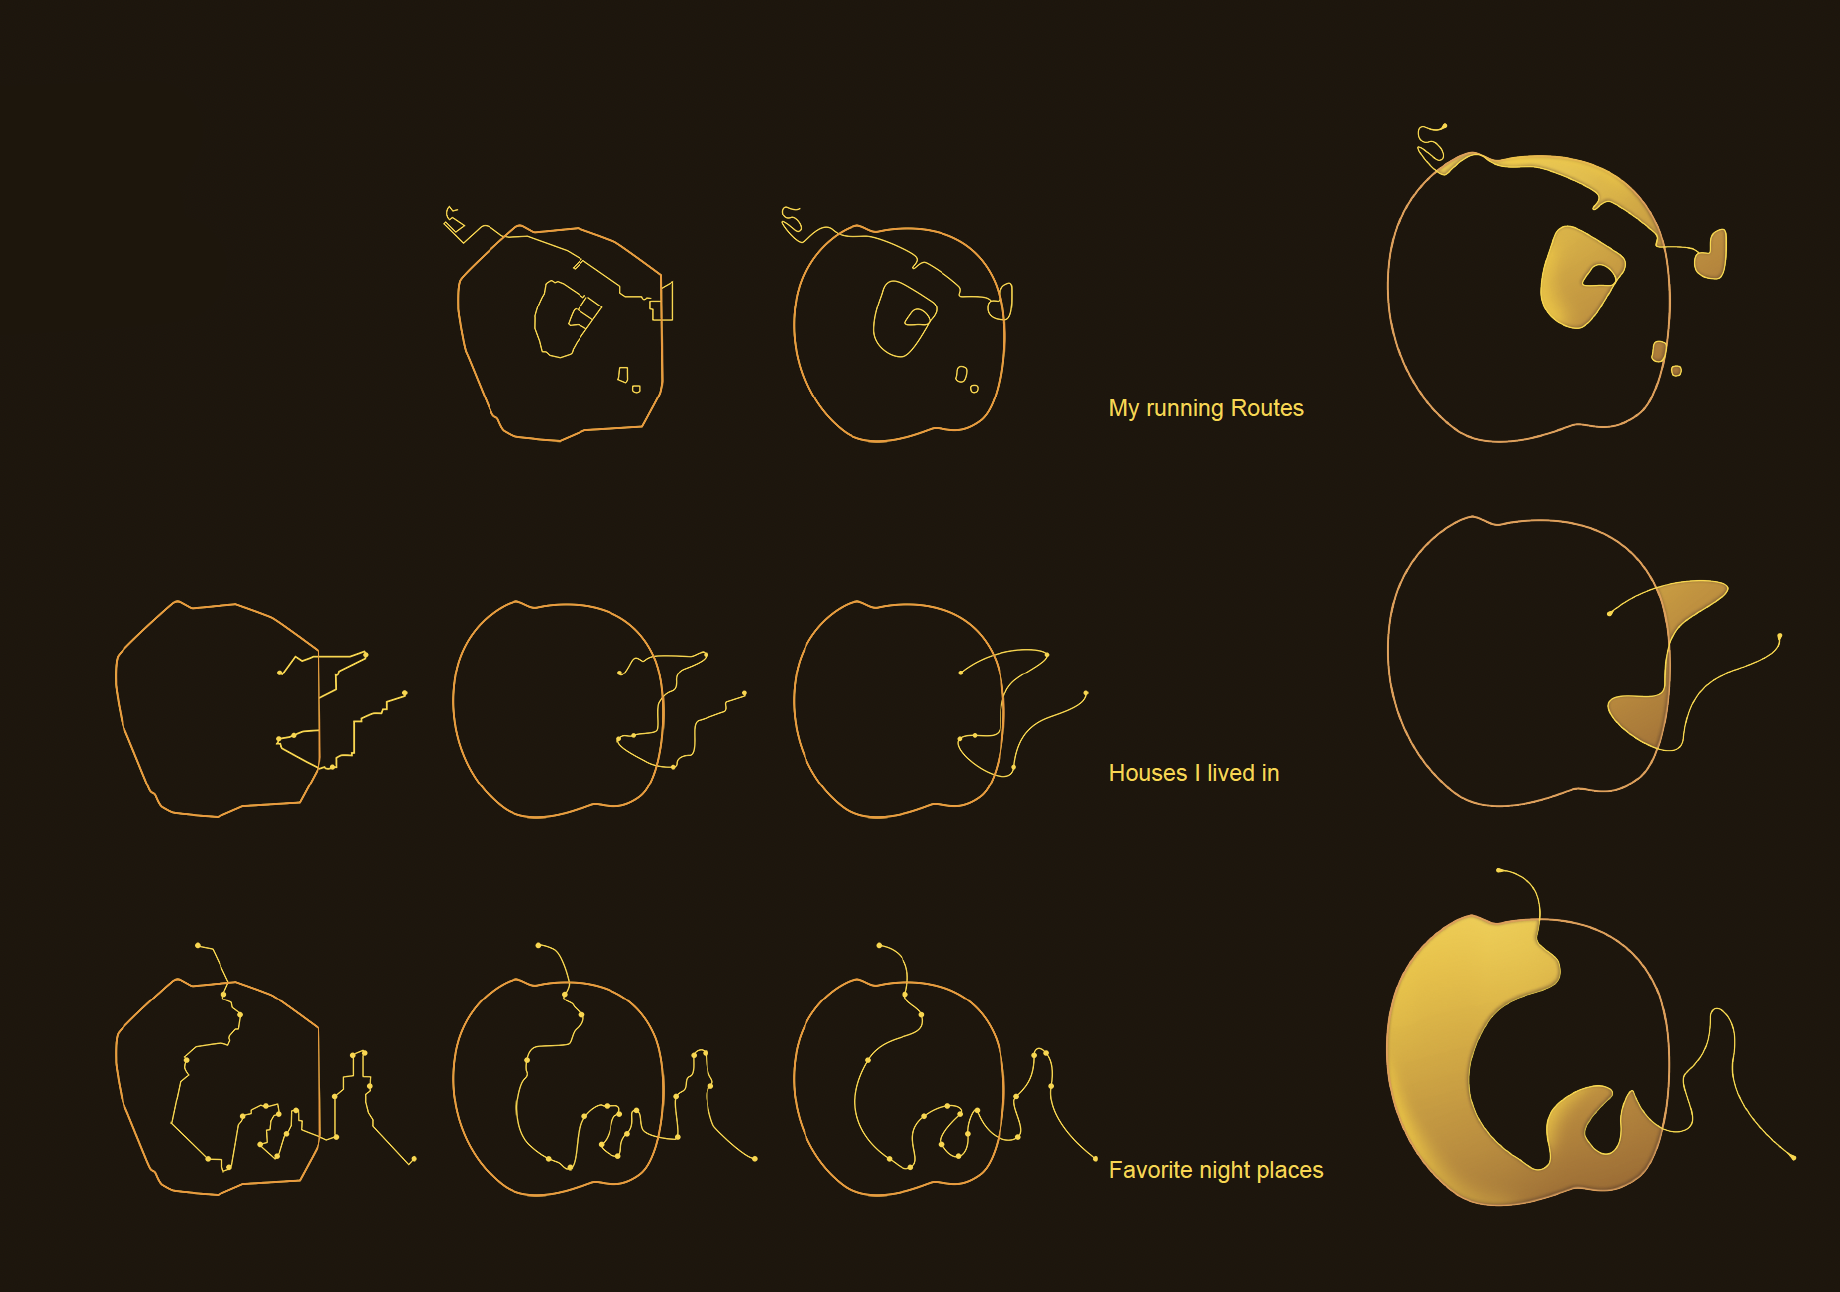
Data Points Mapped:
Residences
Favorite social and night spots
Running routes
Top gelato places


First Month
My first attempt at data visualization involved charting a month of daily calls and interactions, exploring patterns in mood, connection, and activity. Using symbols, shapes, and patterns, I visualized how simple moments “like a phone call” could influence one’s day.


Visual Concepts I Experimented With:
Call frequency patterns
Time allocation charts
Mood vs. activity graphs


After Quarantine
During Italy’s Covid-19 lockdown, I started tracking my daily habits, video calls, workouts, and meals. Through this, I created systems to help manage my physical and mental wellbeing and designed a series of postcards using data-inspired graphics to stay connected with friends.
Visual Concepts I Experimented With:
Personal activity logs
Video call frequency graphs
Data-based motivational postcards


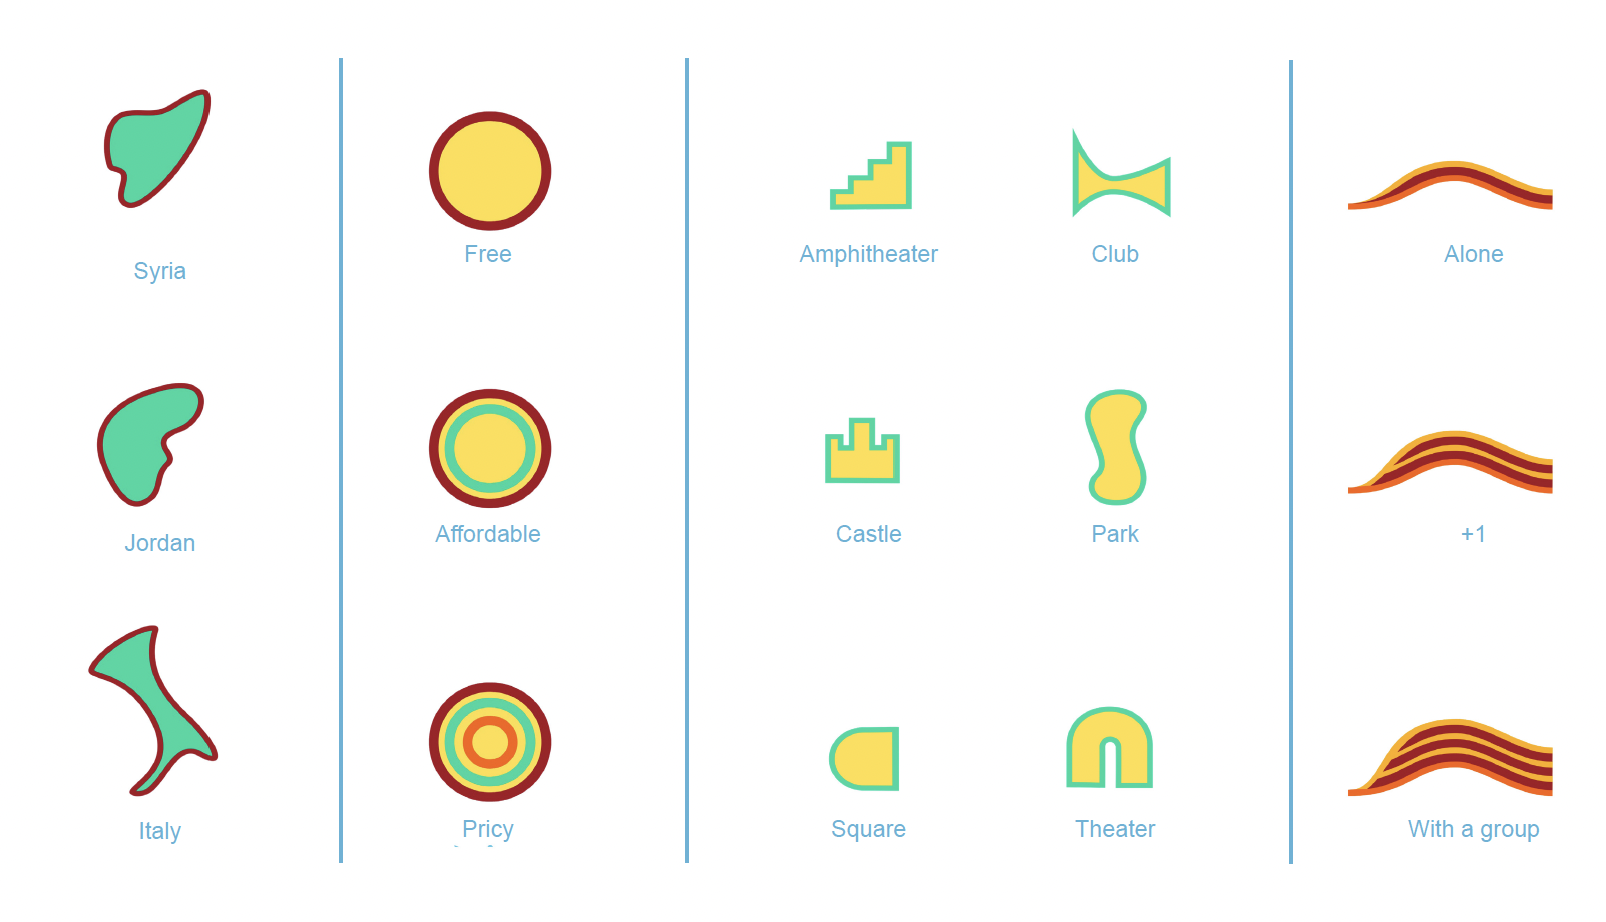
Concertati
As my interest grew, I turned to another passion: live music. I visualized all the concerts I’d attended, categorizing them by genre, location, company, venue type, and affordability. This resulted in a playful, color-coded pattern design that also inspired me to conceptualize a concert archive app.
Key Elements:
Genre-based patterns
Venue and company typologies
Custom concert posters
Personal app interface mockup